支招雅思小作文(127) | 动态图 钢铁产量和工人数量
阅读量:
分享雅思考试小作文真题范文。每一篇范文都经由专业团队反复校对,最终外教审查定稿。成功就是日复一日那一点点小小努力的积累。
The graphs below show the information about the UK Steel Industry from 1970 to 2000. (20230114) (数据存在细微偏差)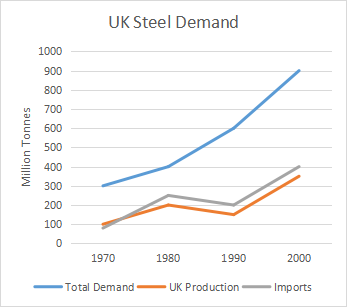
类型:动态图——双折线图
写作注意点:
1. 两个图之间的联系
2. 复杂趋势的描述
The two line charts illustrate changes in the amount of steel needed and supplied in the UK and the scale of workforce for this industry between 1970 and 2000.
【开头段:概括图表主要内容。通过同义替换改写题目。】
Overall, although the amount of steel required by the UK market soared throughout these 30 years, the steel supply witnessed some fluctuations. It is also worth-noting that there was a direct correlation between the number of workers in this area and the steel production as well as imports.
【总结段:也可写在结尾。总结两幅图表之间的联系以及两幅图中的总体特征。】
According to the first chart, the total UK steel demand ballooned beyond all recognition, which tripled from 300 million tonnes (mt) in 1970 to 900 mt in 2000. However, there had always been an insufficiency in the amount provided. Starting from 100 mt in 1970, the quantity of steel produced locally upticked until 1980 before it dipped to 150 mt in the next decade. The figure later rose significantly to 350 mt in the end. Likewise, the data of steel imports also grew with some fluctuations. Despite being at a slightly lower level at the beginning, the amount soon overtook that of local steel in the 1970s. British people relied more on steel from abroad than the local one from then on, and the statistics reached an apogee of 400 mt in 2000.
【主体段1:描述图一的趋势和对比。注意描述多条折线时,句式的多样性。】
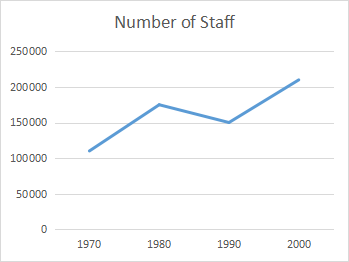
The number of people who worked for this industry was proportional to the steel provision. The number of employees increased to roughly 175 thousand when there was more steel available in 1980. From this time onwards, the figure reduced marginally by 25 thousand before peaking at over 200 thousand in 2000, at which time the supply of steel also hit its maximum.
【主体段2:描述图二的趋势并与图一对比。】