雅思作文3 I 静态表 六个国家用水量对比

分享雅思考试小作文真题范文。每一篇范*都经由专业团队反复校对,最终外教审查定稿。成功就是日复一日那一点点小小努力的积累。
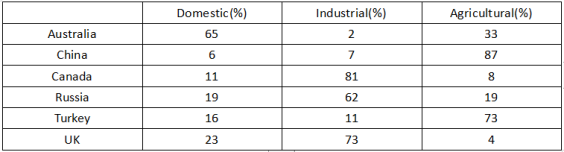
The table compares the proportion of water usage for domestic industrial and agricultural purposes in six countries of the world in the year 2003.
【主体段分段】:按照<国家>分段
Body 1:Canada, Russia, UK【都在Industrial数据】
Body 2:剩下3个国家【Australia→Domestic,China & Turkey→Agricultural】
【开头段】
The table presents information about residential, industrial and agricultural water usage in six different countries for the year 2003.
【概述段】
It is clear that in Canada, Russia and UK, more water was distributed in industry, while agricultural water usage accounted for the largest part in China and Turkey. Australia was the only country where people used most of the water for their daily life.
思路要点:
- Canada, Russia, UK:Industrial用水最多
- China & Turkey:Agricultural用水最多
- Australia:Domestic用水最多
【Body 1】
Looking at the information in more detail, we can find that Canadians, Russians and British people used most of their water for industrial process, with the figure in Canada exceeding 80%. Also, water used for the other two purposes shared a similar figure in the former two countries, with the figure of roughly 10% and 19% respectively. However, the proportion of domestic water usage in Britain(23%) was around 5 times as large as the figure for agricultural water usage in this country.
思路要点:Canada, Russia, UK
- 工业用水最多,只有Canada的数据超过80%
- Canada和Russia的domestic用水、agricultural用水数值相似,分别大约为10%和19%
- UK:domestic用水大约是agricultural用水的5倍
【Body 2】
The figures in the other three countries showed a different pattern. The majority of water resources was allocated to agriculture in China and Turkey, with the figure of 87% and 73%. In both of these two countries, a similar figure could be found in the water used for daily life and industry. In Australia, however, 65% of the water went to domestic use, but water consumption in industrial field represented only 2%.
思路要点:
- 其余三个国家,用水量分配呈现不同规律
- China和Turkey:
- 都是agricultural占比,分别是87%和73%
- 这两个国家内部residential和industrial:数据相似
- Australia:Domestic用水有65%,但是Industrial用水仅占比2%


热门项目
免费预约试听
- 雅思
- 托福
- A-Level
- 留学
- 考研
- KET/PET
- OSSD
- DSE
- TOEFL Junior
- 多领国
- 小语种
- 锦秋国际
- AP
- GRE/GMAT
- SAT/ACT
- PTE
- 腾飞计划
- 其他
备考工具

热门活动
热门文章