

雅思写作A类图表作文(Task 1)
2014-04-08 16:28 供稿单位: 新航道
出国英语考试有哪些 雅思6.5是什么水平 雅思阅读评分标准 托福阅读评分标准 雅思和托福的区别
在近些年的雅思A 类考试中,Task 1 的题型可以分为两大类:数据类图表作文和非数据类图表作文,前者占每年出题比例的90% 左右,后者只占10% 上下。
一、数据类图表作文
1、 从图形的类别上看,有以下4+1 种题型:
Line chart/graph 线形图
Pie chart 饼状图
Bar chart 柱状图
Table 表格题
Mixed graphs 混合类图表,即以上四种数据类图表的任意两者相结合
亲,觉得很多吗?
——不多。
恭喜你,你具备了成功最重要的两个素质:努力,以及藐视困难的心态。有了这些,再加上本书里面的真题和精华资源,你的雅思作文一定会完成“一个屌丝的”,你肯定会是的胜利者。加油!
——好多啊。
首先,你需要努力一下了,尽快让自己具备楼上童鞋的心态。其次,我悄悄地告诉你,其实“题型”还可以少一点——2+1 种足够了。
2、 从图表展现的信息特征上看,可以分为2+1 种题型:
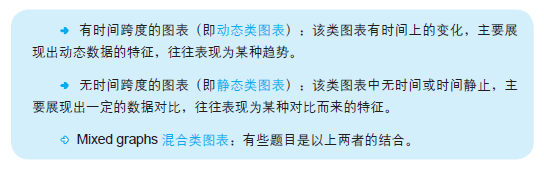
接下来,将从上述2 + 1 种题型梳理“数据类图表作文”的写作技巧。让亲跟它们来次亲密接触,然后潇洒地说再见。
( 一) 动态类图表作文写作
题库真题 1
You should spend about 20 minutes on this task.
Write at least 150 words.
典型范文
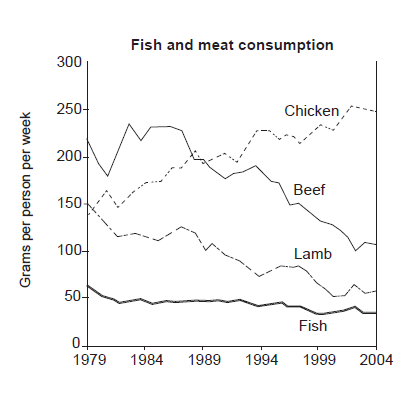
The graph illustrates changes in the amounts of beef, lamb, chicken and fish consumed in a particular European country between 1979 and 2004.
In 1979 beef was by far the most popular of these foods, with about 225 grams consumed per person per week. Lamb and chicken were eaten in similar quantities (around 150 grams), while much less fish was consumed (just over 50 grams).
However, during this 25-year period the consumption of beef and lamb fell dramatically to approximately 100 grams and 55 grams respectively. The consumption of fish also declined, but much less significantly to just below 50 grams, so although it remained the least popular food, consumption levels were the most stable.
The consumption of chicken, on the other hand, showed an upward trend, overtaking that of lamb in 1980 and that of beef in 1989. By 2004 it had soared to almost 250 grams per person per week.
Overall, the graph shows how the consumption of chicken increased dramatically while the popularity of these other foods decreased over the period.
参考译文
这幅图展示了某一个欧洲国家从1979 到2004 年间所吃的牛、羊、鸡肉和鱼肉的数量变化。
1979 年,牛肉是四种食物里面消费量的,大约每人每周消耗225 克。羊肉和鸡肉的消费量差不多,大概150 克,然而鱼肉要少得多,只有50 克多点。
但是,在1979 至2004 这25 年间,牛羊肉的消费量急剧下降,分别降至100 克和55 克左右。鱼肉的消费量也有所下降,但幅度没有那么大,数量仅低于50 克。所以,尽管它一直是吃的最少的食物,其消费水平是最稳定的。
与之相反,鸡肉的消费量呈上升趋势,在1980 年超过了羊肉,在1989 年超过了牛肉。到2004 年的时候,人均每周消费量已飙升至250 克左右。
总体而言,这幅图展示了在一段期间里,鸡肉的消费量是如何快速地增长以及其他三种食物的消费量是如何下降的。
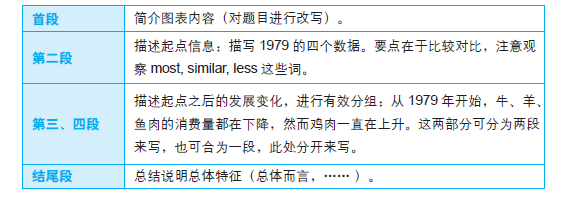
方法点拨
• 本题源自IELTS 7, TEST 2。真正学会这篇作文的信息点选择和组织方式,也就会了所有动态图表作文的写作。
• 范文的具体结构如下:
词汇积累
亮点句型
句型1 Lamb and chicken were eaten in similar quantities (around 150 grams), while much less fish was consumed (just over 50 grams).
点评 首先,学习被动语态的使用,使自己的句型多样化。其次,括号的使用,使引用数据变得简洁清晰,不过不能过度。
句型2 The consumption of fish also declined, but much less significantly to just below 50 grams, so although it remained the least popular food, consumption levels were the most stable.
点评 亲们先看其汉语翻译,想想自己将如何组织句子呢?然后猛然回首,发现“不二法门”就在“also, but, so, although(也,但是,所以,尽管)”四个衔接词的使用上,把松散的信息组织到了一块儿。这同时完美体现了高分作文的要求:对数据进行比较对比。
句型3 The consumption of chicken, on the other hand, showed an upward trend, overtaking that of lamb in 1980 and that of beef in 1989.
点评 “On the other hand”用作插入语,放在主语“the consumption”后面。“Overtaking”为非谓语动词的用法,使句子更加整合,而不是写it overtook…。“That”指代consumption,否则该词就得重复出现三次,显得啰嗦。
题库真题2
You should spend about 20 minutes on this task.
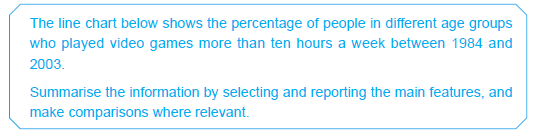
Write at least 150 words.
- 上一篇:雅思口语以y结尾的实用小词
- 下一篇:雅思阅读真题还原及解析

- 时时分享励志成长、英语学习、考试信息、留学动态等。《轻松学英文》致力于为广大英语学习爱好者提供青少英语、雅思、托福、SAT及留学规划等学习和资讯内容,力求帮助学生提高英语运用能力,在轻松快乐的环境中走向英语成功之道!
精彩专题
更多


视频荟萃
更多
-
新航道姚骏鹏-雅思阅读高分攻略
时长:03-06

-
新航道陈侃侃-雅思口语要有范儿
时长:03-06

-
【3分钟学雅思】王大锤告诉你为啥药不能停
时长:01-12

-
【3分钟学雅思】全世界个感官餐厅
时长:01-12
热门文章
更多
-
8月31日雅思广州考机考初体验
选择机考模式的考生将通过机考模式参加听...