雅思写作:图表类写作

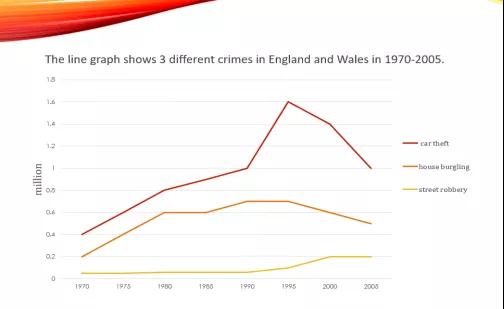
The lines illustrate the changing numbers of three different crimes in England and Wales over a 35-year period of 1970 to 2005.

In 1970, of all the crimes shown, car theft happened most frequently数据大=最常发生的案件, with 0.4 million reported. This figure was on the exponential growth避免过分依赖动词描述趋势 until 1990, when it reached 1 million, followed by an even steeper growth两段上升也可以作幅度比较 to the all-time high (1.6 million) in just five years. In 2005, the cases, plummeting to its 1990 level though, were still most committed即便案件量陡降,却依然是最多被犯下的罪行.
Similar trend could be seen in the number of house burgling cases, especially in the initial ten years, jumping by 0.4 million as well, from 0.2 to 0.6 million. The subsequent decades时间作主语witnessed slighter deterioration and alleviation选择“情况恶化”和“缓解”来避免数据信息枯燥, with the maximum of merely 0.7 million and 0.2 million fewer in 2005. Street robbery, the least committed crime of three同位语, was constantly within a narrow range of approx. 0.05 to 0.2 million.
Overall, from 1970 to 2005, in England and Wales, the chance of having cars stolen or house burgled was rather high, while that of being robbed on the street far lower.
更多关于雅思写作的个性化问题敬请咨询新航道官网

热门项目
免费预约试听
- 雅思
- 托福
- A-Level
- 留学
- 考研
- KET/PET
- OSSD
- DSE
- TOEFL Junior
- 多领国
- 小语种
- 锦秋国际
- AP
- GRE/GMAT
- SAT/ACT
- PTE
- 腾飞计划
- 其他
热门活动


