雅思小作文示范写作:静态柱图 七个国家人口分布

雅思小作文示范写作:静态柱图 七个国家人口分布
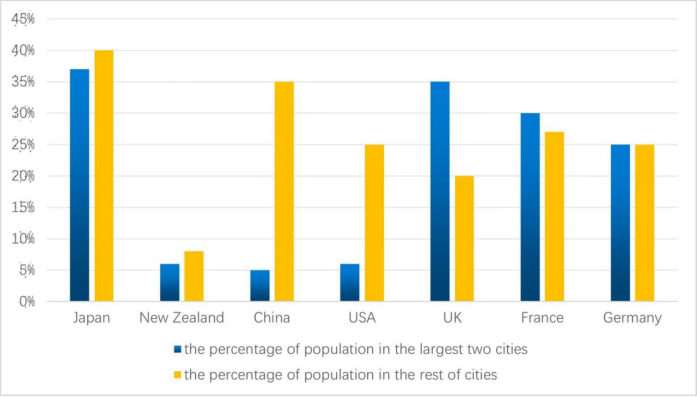
The chart below shows the percentage of population in the largest two cities and the rest of cities in seven countries in 2017.
主体段分段:主体1:Japan,New Zealand, China, USA(黄色>蓝色)主体2:UK、France(蓝色>黄色),Germany(黄色=蓝色)
开头段
The bar chart illustrates the population distribution across seven countries, comparing the proportions of citizens living in the largest two cities with those in all other cities in 2017.
概述段
Overall, Japan had the highest proportion of urban population, while New Zealand had the lowest. Germany was the only nation where the population was split equally between the two types of cities, whereas China exhibited the most dramatic disparity between these two demographic groups.
思路要点:
- Japan双色数值都,New Zealand双色数值都
- 只有Germany双色数值相等,China双色差距
Body paragraph 1
It is clear that people from four countries displayed a clear preference for living outside the primary urban centers. This was most pronounced in China, where 35% of the population lived in other cities, compared with only 5% in the top two. A similar pattern appeared in the USA, where 25% resided in smaller cities, five times the proportion in the largest ones. Japan and New Zealand demonstrated smaller differences between the two groups (roughly 3%), with approximately 40% and 8% living in other cities, respectively.
思路要点:Japan,New Zealand, China, USA
- 有四个国家黄色>蓝色
- China:双色差距,黄色数值为35%,但蓝色数值仅为5%
- USA:双色差距也较大,黄色数值为25%,是蓝色的5倍
- Japan、New Zealand:双色差距相似(约为3%),其中Japan黄色占比40%,New Zealand黄色占比8%
Body paragraph 2
Conversely, in the UK, a larger share of its population (approximately 35%) resided in the two largest cities, in contrast to 20% in other urban areas. In France, the distribution was relatively balanced, with about 30% residing in the top two cities and 27% in smaller ones. Germany showed an equal division, with both categories accounting for roughly 25% of the population.
思路要点:UK,France,Germany
- UK:蓝色(35%),显著超过黄色(20%)
- France:双色差距较小,蓝色数值为30%,黄色数值为27%
- Germany:黄色、蓝色占比相同,都为25%


热门项目
免费预约试听
- 雅思
- 托福
- A-Level
- 留学
- 考研
- KET/PET
- OSSD
- DSE
- TOEFL Junior
- 多领国
- 小语种
- 锦秋国际
- AP
- GRE/GMAT
- SAT/ACT
- PTE
- 腾飞计划
- 其他
备考工具

热门活动
热门文章