

5月23日雅思小作文示范写作 | 某国现场观看体育比赛人数比例

分享雅思考试小作文真题范文。每一篇范*都经由专业团队反复校对,最终外教审查定稿。成功就是日复一日那一点点小小努力的积累。
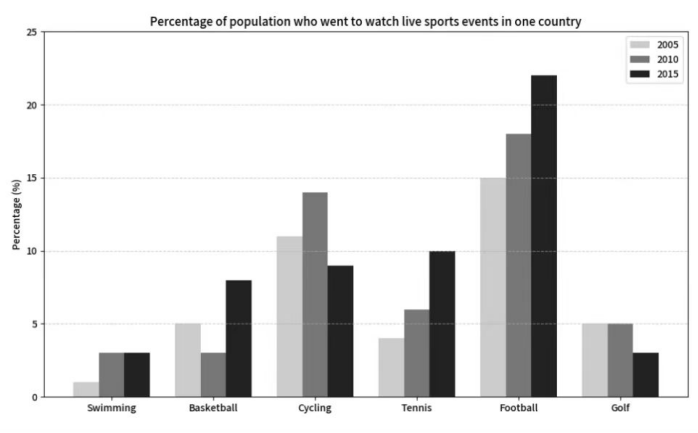
The chart below shows the percentage of population who went to watch live sport events in one county.
主体段分段方法:
主体1:football、tennis、swimming、golf
主体2:basketball、cycling
开头段
The bar chart compares the proportions of people who attended six different live sports events in a particular country in 2005. 2010 and 2015.
概述段
Overall, most sports experienced a rise in popularity, with the exception of cycling and golf. Among the six sports, football remained the most popular throughout the period, while swimming consistently attracted the fewest viewers.
思路要点:
- 除cycling、golf外,都上升
- football观看人数始终最多,swimming观看人数始终
Body paragraph 1
The figures for football and tennis increased steadily, rising significantly from 4% to 10% and from 15% to 23% respectively. Althoughswimming remained the least popular sportover the given period, its figure tripled to 3% between 2005 and 2010.followed bya period of stabilityuntil 2015. In contrast, the golf attendance remained unchanged at 5% in 2005 and 2010. after which it fell slightly to 3% in 2015.
思路要点:football、tennis、swimming、golf
- football、tennis:持续上升,分别从4%上升到10%、从15%上升到23%
- swimming:观众人数始终,2005-2010年期间上涨了3倍达到3%→随后到2015年保持平稳
- golf:2005-2010年观看人数平稳在5%→随后到2015年小幅下降到3%
Body paragraph 2
Basketball and cycling, however, experienced notable fluctuationsover the period. Starting at 5% in 2005. the attendance rate of basketballdropped to a low of3% in 2010. beforegrowing rapidly to 8% by 2015. Conversely, cyclingsaw a modest increase from 11% to 14% between 2005 and 2010. beforedropping sharply to 9% in 2015.
思路要点:basketball、cycling
- basketball、cycling经历了显著波动
- basketball:2005年观看人数为3%→最后2010年下降到点3%→2015年急剧上升到8%
- cycling:2005年到2010年从11%上升到14%→2015年急剧下降到9%

相关文章



热门项目
免费预约试听
- 雅思
- 托福
- A-Level
- 留学
- 考研
- KET/PET
- OSSD
- DSE
- TOEFL Junior
- 多领国
- 小语种
- 锦秋国际
- AP
- GRE/GMAT
- SAT/ACT
- PTE
- 腾飞计划
- 其他
备考工具

热门活动
热门文章