
[2024/ 2/ 24] The charts and table below show the percentage of customers choosing different kinds of websites when shopping online and the percentage of customers shopping online for different reasons in two countries in 2020.
【主体段分段】:按照图分段
Body 1:2个饼图
Body 2:表格
【开头段】
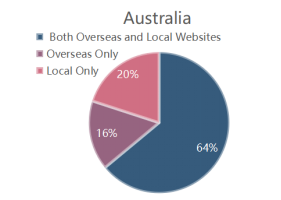
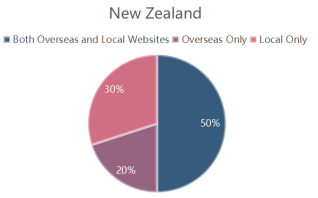
The pie charts compare the preference of websites for online shopping among consumers in Australia and New Zealand, and the table reveals motivations that moved consumers to shop online in these two countries in 2020.
【概述段】
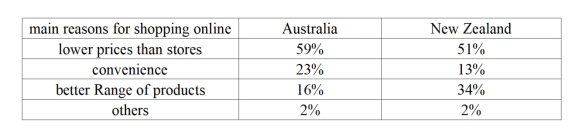
Obviously, more people chose to shop online both through foreign and local websites in these two countries. Besides, a lower price was the dominant factor for buyers to make a purchase online in both countries.
**语言点提示:生活化描述
思路要点:
- 两个国家中,both overseas and local websites占比都
- lower prices than stores数值都
【Body 1】
Looking at the pie charts in more detail, we can see that customers shopping online via both international and domestic websites accounted for the largest proportion among all the surveyed people, with the figure of 64% in Australia and 50% in New Zealand. By contrast, only 16% of Australian buyers and 20% of those in New Zealand relied solely on local websites. The rest online shoppers in these two countries were attracted by international websites.
思路要点:饼图
- 【】两个国家中,深蓝色(both overseas and local websites)占比分别为64%和50%
- 【】对比而言,只用local websites购物的人数比例分别为:Australia→16%,New Zealand→20%
- 两个国家中剩下的人选择只去overseas websites网购
【Body 2】
In terms of main reasons for shopping online,it is clear that more than half of the surveyed consumers in both countries decided to make a purchase because of lower prices. Better range of products and convenience were considered by roughly the same percentage of Australian customers, with the figure of around 20%. However, in New Zealand, the proportion of people buying items due to their range of choices was 34%, which was almost 3 times as large as the figure for convenience.
思路要点:表格→main reasons for online shopping
- 两个国家中,lower prices than stores占比都超过一半
- Better range of products 和 convenience:
- Australia:数据相似,大约是20%
- New Zealand:better range of choices→34%,是convenience的几乎3倍
新航道-用心用情用力做教育!