
The graph below shows the percentage of people by age group visiting the cinema at least once per month in one particular country between 1978 and 2008.
【主体段分段】
Body 1:15-24(始终)、35 and over(始终)
Body 2:其余2个年龄组
【开头段】
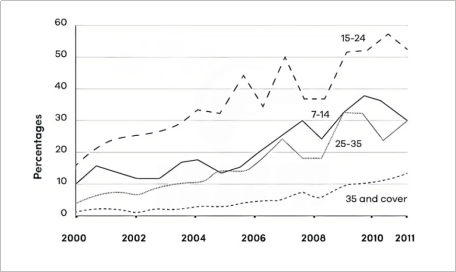
The line chart illustrates changes in cinema attendance among 4 age groups who went to the cinema at least once a month in a specific country from 2000 to 2011.
【概述段】
It is clear that the theater attendance experienced an upward trend for all the age groups, and the 15-to-24-year-olds remained to be the dominant group of audience throughout the given period.
思路要点:
- 四个年龄段数据都上升
- 15-24的数据一直
【Body 1】
Looking at the information in more detail, we can find that 15% of people aged 15-24 went to the cinema monthly in the initial year. After a remarkable rise to over 30% in 2004, this figure fluctuated between 35% and 52% for several years, peaking at 58% in 2009. By contrast, the oldest group(35 and over) had the lowest cinema attendance in the 11 years, growing steadily from roughly 2% in 2000 to 12% in 2011.
思路要点:
- <25-24>:2000年15%→到2004年显著上升到30%→随后在35%-52%之间波动→2009年达到峰值58%
- <25 and over>:始终,2%逐步上升到12%
【Body 2】
Similar trends could be found in the figures for the other two groups of people. The proportion of the cinema goers aged 7-14 surged from 10% to roughly 38% in the beginning decade, followed by a significant decline to 30% in the final year. However, only 5% of the 25-to-35-year-old people claimed to visit the cinema every month. Subsequently, this figure underwent some flucturations and increased by almost 7-fold to the highest point in 2009. After a dramatica fall, it finally rose to the same figure as the attendance from the youngest group in 2011.
思路要点:
-<7-14>:2000-2010急剧上升到38%→2011年显著下降到30%
-<25-35>:2000年5%→随后波动,到2009年几乎上升7倍达到值→急剧下降→2011年上升,和7-14交点
新航道-用心用情用力做教育!