
Task1:
The graphs below show the size of the ozone hole over Antarctic and the production of three ozone-damaging gases from 1980 to 2000. Summarise the information by selecting and reporting the main features, and make comparisons where relevant.
参考范文
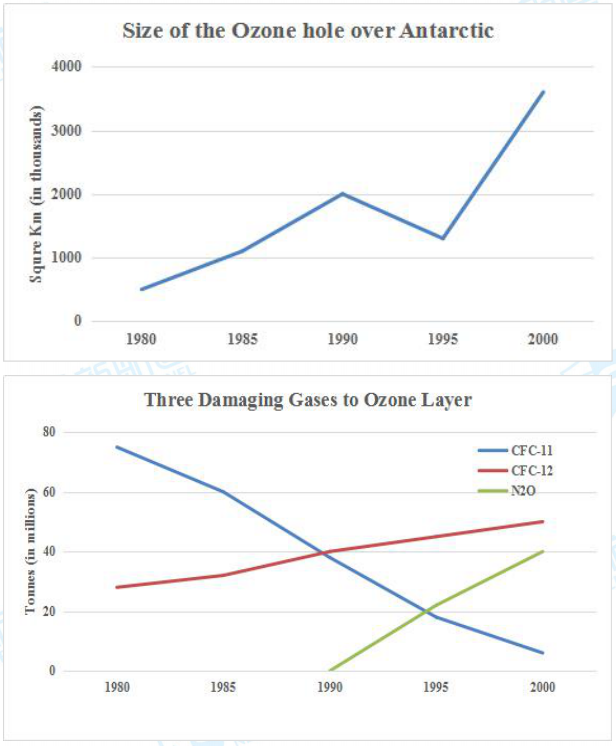
The line graphs illustrate the change in the size of the ozone hole over Atlantic and how many tonnes of damaging gases were produced between 1980 and 2000. It can be seen from the first chart that the size of the Ozone hole significantly increased albeit a dip during the two decades. The first decade witnessed a steady rise from approximately 500,000 km2 to 200,0000 km2 . In the following five years, the size fell gradually to roughly 1250 km2 , which was subsequently followed by a sharp climb to almost 350, 0000 km2 in 2000. The second graph compare the quantities of three categories of gases damaging to Ozone Layer. As can be seen from the chart, CFC-11 was the only type of damaging gas which experienced a downward trend from almost 80 million tonnes in 1980 to nearly 10 million tonnes in 2000. The same period, on the other hand, witnessed a steady increase from 30 million to 50 million tonnes. In addition, N2O was the newest kind of gas which appeared in 1990 and then rose dramatically to 40 million tonnes in 2000.
TIPS:
每场雅思考试结束后
我们会同步更新(每周一)
由唐伟胜老师编写的
雅思大作文范文
02月10日雅思大作文范文,请:2018年02月10日雅思大作文题目解析+参考范文
需要2018.02.10雅思机经的同学请:2018.02.10雅思完整机经回忆