
[2023/ 10/28] The chart below shows the water levels in reservations in six cities in Australia in October 2009 and October 2010.
【主体段分段】:按照时间分段
【开头段】
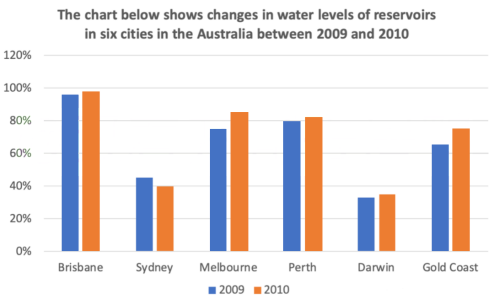
The bar chart compares six Australian cities in terms of water levels of reservoirs in October 2009 and October 2010 .
【概述段】
Overall, Brisbane had the highest water level of reservoir among all the cities in both years. Also, except the water level in Sydney, the figures in all the other five cities showed a rising trend.
思路要点:
- Brisbane的水库水位两年都
- 除了Sydney,其他城市的水位都上升
【Body 1】
In 2009, the water level in Brisbane ranked the top among these cities(98%), followed by the figure in Perth(80%) and that in Melbourne(78%). By contrast, the water level in Darwin was the lowest(36%), which was roughly half of the figure in Gold Coast.
思路要点:2009年
- Brisbane水位排,Perth和Melbourne分别排名第二、第三
- Darwin水位,大约是Gold Coast的一半
【Body 2】
In the subsequent year, there emerged a marginal growth by 2% in the water levels of reservoirs in Brisbane, Perth and Darwin. The water levels in Melbourne and Gold Coast also experienced an upward trend, with the figures rising considerably by 5%. By contrast, Sydney was the only city where the water level of reservoir dropped significantly from 44% in 2009 to 40% in 2010.
思路要点:2010年
- Brisbane, Perth and Darwin的水位小幅度上升
- Melbourne和Gold Coast 的水位显著上升
-只有Sydney的水位显著下降